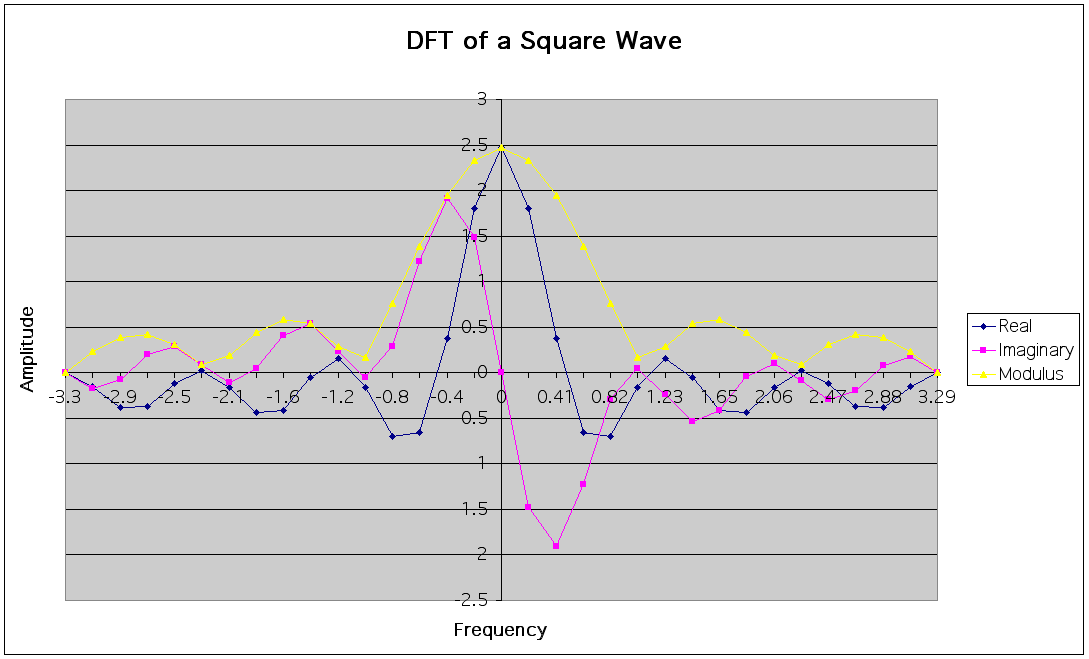
DFT of a Square Wave
Any function (signal) can be decomposed into purely sinusoidal components (sine waves of different size/shape) which when added together make up our original signal.
In the example below (Fig 7.4) we have a square wave signal that has been decomposed by the Fourier Transform to render its sinusoidal components. Only the first few sine wave components are shown here. You can see that a the Square wave form will be roughly approximated if you add up the sinusoidal components.

DFT of a Square Wave
Thus Transforming a signal into the frequency domain allows us to see what sine waves make up our signal e.g. One part sinusoidal wave at 50 Hz and two parts sinusoidal waves at 200 Hz.
More complex signals will give more complex graphs but the idea is exactly the same. The graph of the frequency domain is called the frequency spectrum.
An easy way to visualise what is happening is to think of a graphic equaliser on a stereo (Fig 7.5).

A Graphic Equaliser
The bars on the left are the frequency spectrum of the sound that you are listening to. The bars go up and down depending on the type of sound that you are listening to. It is pretty obvious that the accumulation of these make up the whole. The bars on the right are used to increase and decrease the sound at particular frequencies, denoted by the numbers (Hz). The lower frequencies, on the left, are for bass and the higher frequencies on the right are treble.
This is directly related to our example before. The bars show how much of the signal is made up of sinusoidal waves at that frequency. When all the waves are added together in their correct proportions that original sound is regenerated.